Infographics
|
Introduction to Infographics Slideshow & Video
Task Make an Infographic to share the concerns you have around plastics. Each person will make his or her own infographic, and the group will decide on which one(s) to include in their public product. Rubric Here is the rubric for the infographic. Steps 1. Identify the focus of your infographic. Some possible topics include plastic water bottles, human health, consumption, plastic straws, recycling & plastic in the ocean. 2. Find data. Each person need to add at least THREE facts for your group's infographic research document. Some possible sources of data: General overview Plastic Straws Ocean Plastic
3. Choose an infographic program. Here are three recommended sites: Easel.ly, Piktochart, & Canva. Piktochart is very easy to use. Canva was a bit more challenging, but many of the infographics looked awesome! |
4. Design your infographic. See student samples at bottom of this page.
Requirements Everyone makes their own infographic using the shared data on your Infographic Research document.
5. Make your infographic public. Watch one of the videos below showing how to do that. 6. Upload link to Google Classroom. |
Share
|
|
|
|
Student Examples
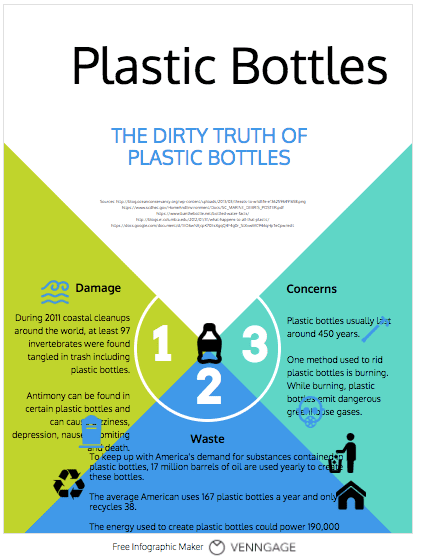
Example 1 - Plastic Bottles


